ISO 9001 Flowchart Basics
This article is a basic instruction on flowcharting, But we also offer:
ISO 9001 Flowchart Training Package
This full featured package includes:
- 27 flow diagrams
- Mapping Workflows Online Course (.2 CEU’s)
A flow chart can:
- Describe a process
- Breakdown a process for easier explanation
- Help you improve a process
Flow charts are simple diagrams that map out a process so that it can easily be communicated to other people. Flow charts can help explain what really happens in a processes as well as their interaction. More importantly, creating a flowchart helps you understand the process and look for improvements. It also helps you focus on each individual step, without feeling overwhelmed by the bigger picture.
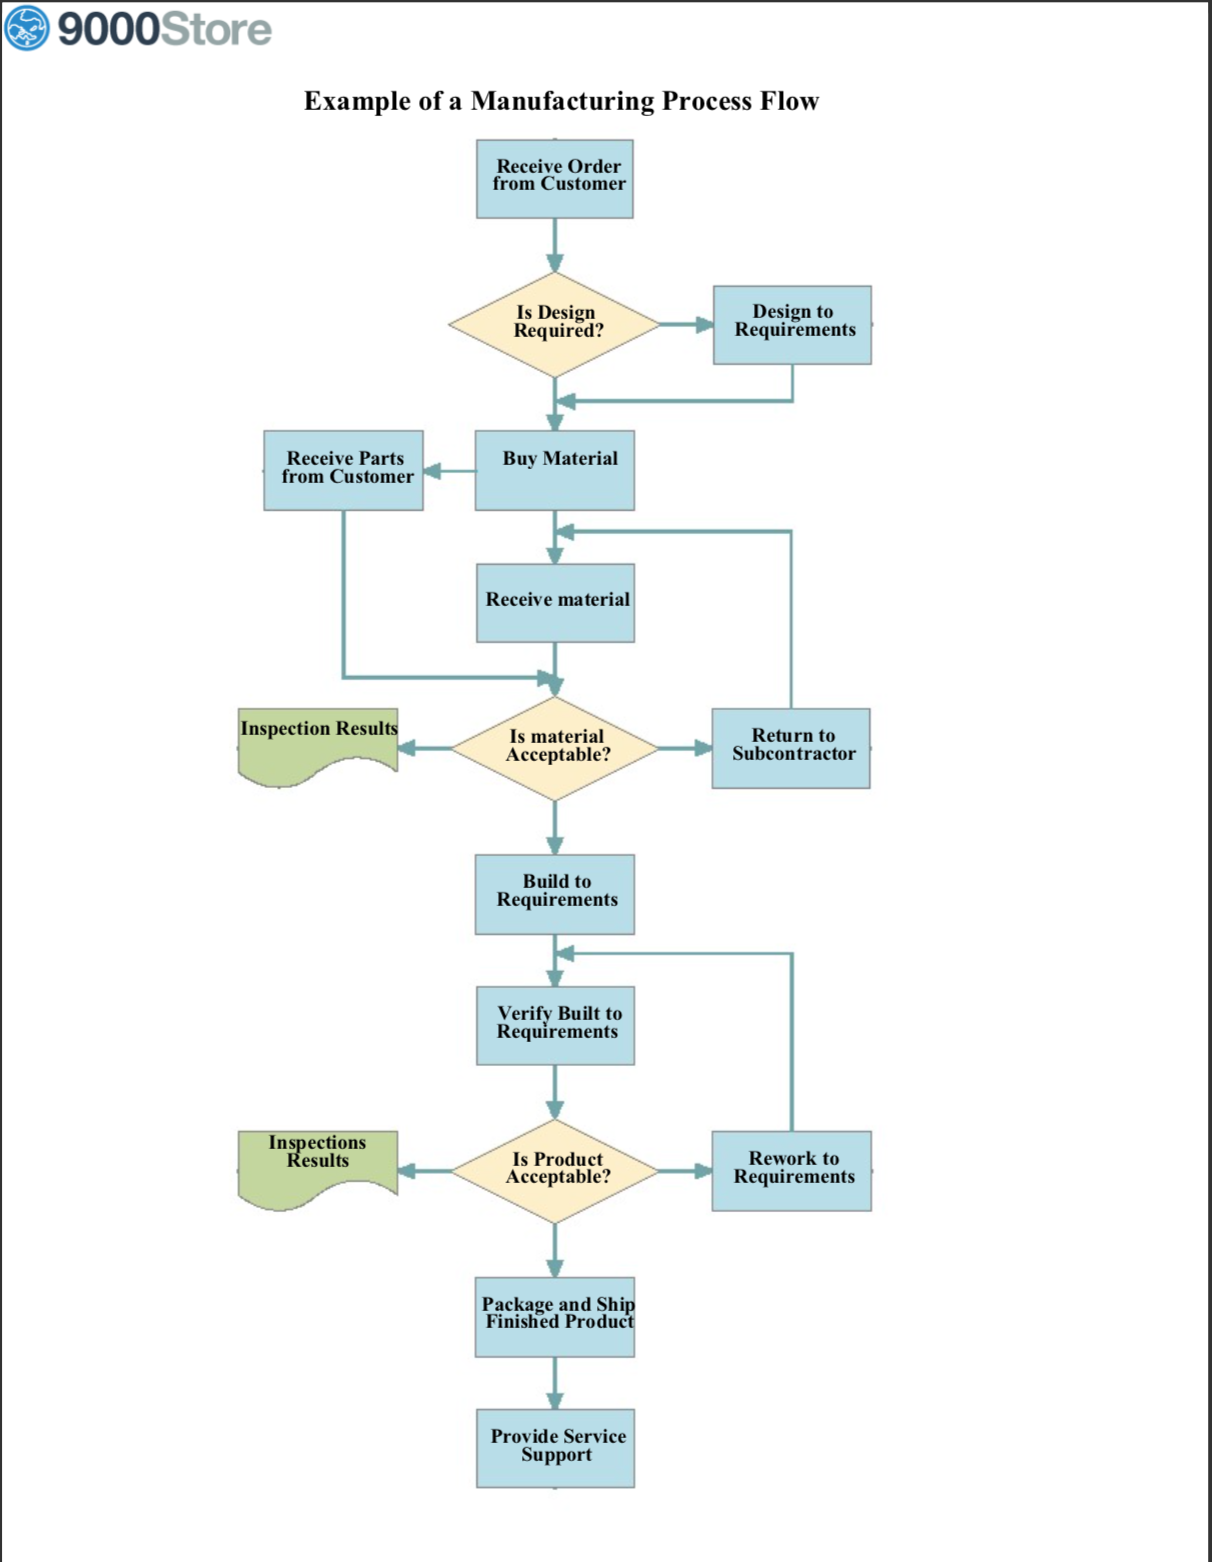
Samples
Flow Chart Basics:
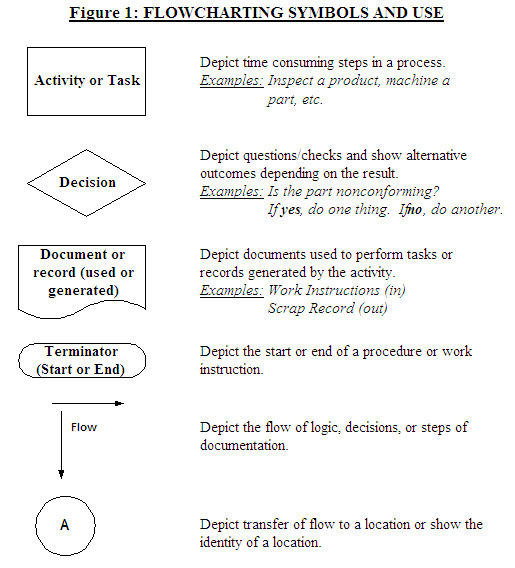
To draw a flowchart, brainstorm the tasks and decisions made during a process, and write them down in order. Enter the purpose (start/stop/decision/etc.) of each symbol within the shape and connect them with arrows to show the direction of the flow.

Tip: Keep it simple
You can use many different flowchart symbols but if people don’t understand them than you’ll fail to clearly communicate your message.
- Begin by listing each step of the process using the symbols above. But don’t be afraid to make mistakes – just put your ideas onto paper and correct them from there.
- Then map these out in flow chart format using appropriate symbols for the start and end of a process, for actions to be taken and for decisions to be made. You will be surprised how much you learn about your organization in this process.
- Finally, challenge your flowchart to make sure that it’s an accurate representation of the process
- Improvement: Ensure that it represents the most efficient way of doing the job.
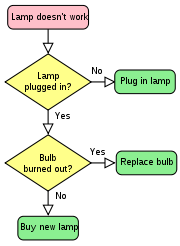
Here is a simple example of a lamp that doesn’t work:

-
Learn how to create Flowcharts and improve processes:
Create Great-Looking Flowcharts & Process Models with LucidChart


